open design
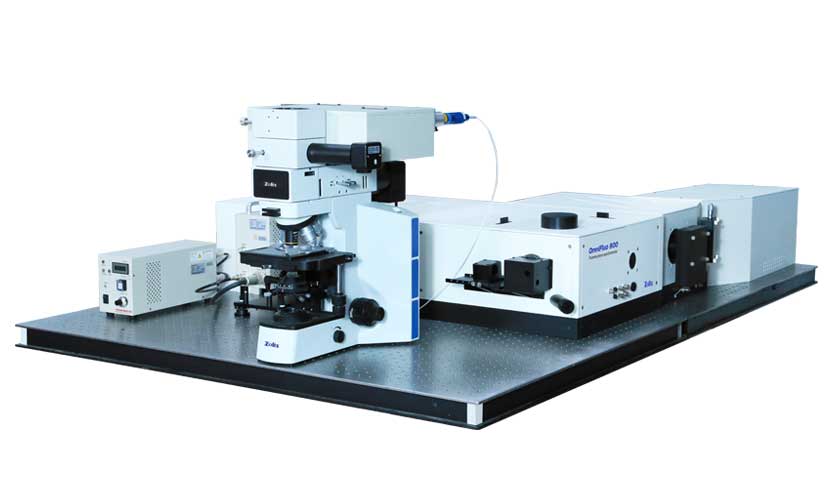
The OmniFluo900 series of steady state transient fluorescence spectrometers are based on the principle of open design and our 20 years of rich experience in designing, manufacturing and quality control of spectroscopic systems. With the time-dependent single photon counter with picosecond resolution, the OmniFluo900 series of steady state and transient spectrometers can conveniently realize a variety of steady state and transient testing functions such as fluorescence spectra, laser-induced fluorescence (LIF) spectra, photoluminescence (PL) spectra, electroluminescence (EL) spectra, and fluorescence quantum yield (QY). Fluorescence spectroscopy, laser-induced fluorescence (LIF) spectroscopy, photoluminescence (PL) spectroscopy, electroluminescence (EL) spectroscopy, and quantum yield of fluorescence (QY) can be easily realized with the time-correlated single photon counter.
High-end performance
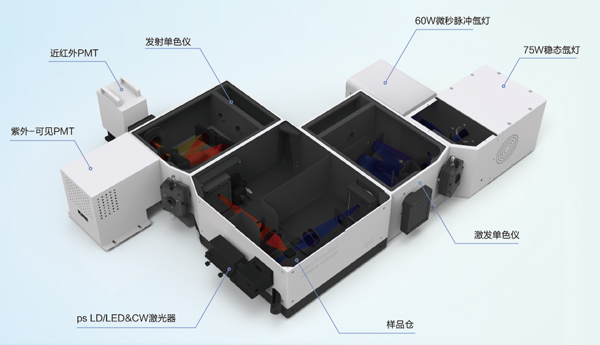
OmniFluo900 series steady state transient fluorescence spectrometer is a multifunctional fluorescence test platform based on steady state fluorescence function and dominated by transient fluorescence function. The system adopts high-performance Omni-λ series image-corrected monochromator/spectrometer, high-brightness complex color light source and multi-wavelength monochromatic light source, high-sensitivity single-photon detector, and large-capacity sample chamber as the core components, together with the carefully optimized design of excitation and emission optical paths, which significantly improves the fluorescence signal detection sensitivity, and the signal-to-noise ratio of pure water Raman can reach more than 10,000:1.
multidimensional characterization
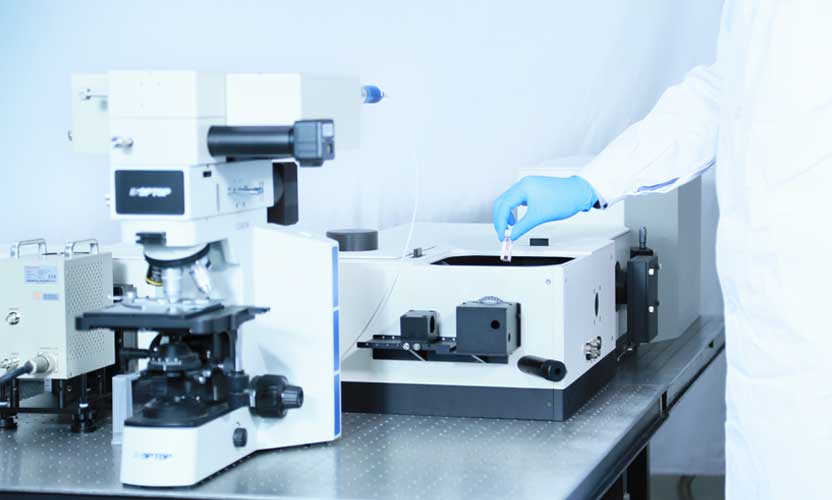
This series of fluorescence spectrometer can be matched with microscopic light path to realize microscopic spectral testing, and can also be matched with Oxford Instruments (Oxford Instruments) temperature control unit and Hamamatsu (Hamamatsu) various types of high sensitivity detectors, to realize the microscopic (high spatial resolution), wide-band, variable-temperature testing, and other dimensions of spectral measurement, for the study of the sample components, analysis of the luminescence, dynamics, theoretical research to provide protection. We provide guarantee for the study of sample components, analysis of luminescence dynamics, and theoretical research.
Basic Performance Test
spectral calibration
As the fluorescence emitted by the sample needs to be focused and spectralized by optical devices such as lenses, spectrometers, etc., and *finally* captured by the detector, while any one of the optical devices and equipment for different wavelengths of light penetration or reflectivity are different.
In order to remove the influence of optics and equipment in the optical path on the relative intensity of sample luminescence, spectral correction is required to restore the true luminescence condition of the sample.
| The figure on the right shows the calibration curves for grating G1 and grating G2 of the emission monochromator. G1-1200g/mm, 300nm Shine G2-1200g/mm, 500nm Shine |
 |
| The yellow line on the right shows the original fluorescence data of the sample under test, and the blue line shows the corrected data of the sample under test. Comparison of the two spectra shows that the peak of the corrected spectrum is red-shifted by 10 nm, i.e., the uncorrected raw data blueshifts the true spectrum by 10 nm. |  |
Conclusion: The corrected spectra can reflect the real luminescence condition of the samples, such as the real luminescence peak positions. For samples with multiple peaks, the corrected spectra more accurately give the relative intensity relationship between several different peaks.
Pure water Raman signal-to-noise ratio SNR ≥10000:1
| Sample: Pure water Excitation wavelength: 350nm Scanning step: 1nm Emission scan: 380nm-450nm Integration time: 1s Peak Signal@397nm=322411 Noise Signal@450nm=680
|
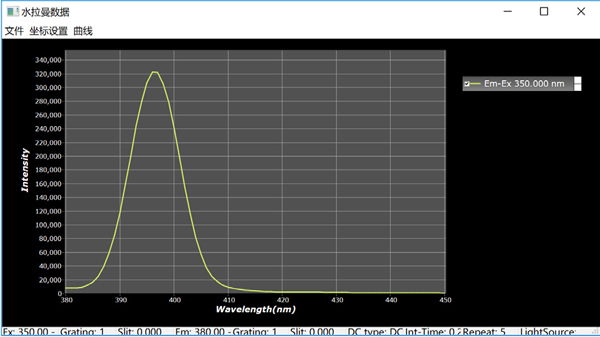 |

Conclusion: The OmniFluo900 series fluorescence spectrometer with single excitation and single emission design can easily achieve a Raman signal-to-noise ratio of more than 10,000:1 for pure water.
Test Object: Mercury Lamp
Scanning step: 0.05nm Repeat: 1 time
|
Actual wavelength (nm) |
Test wavelength (nm) |
|
365.016 |
365.00 |
|
365.484 |
365.45 |
|
366.328 |
366.30 |
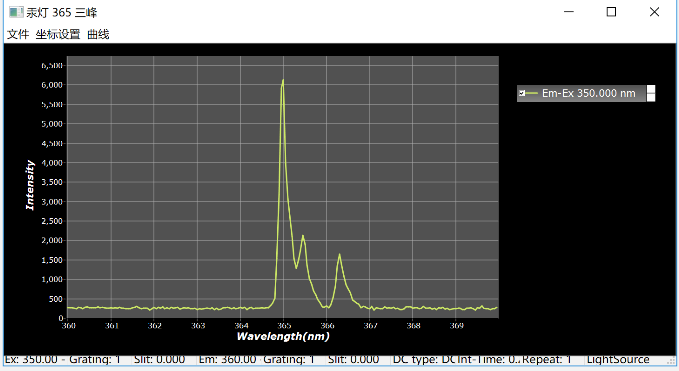
CONCLUSION: The OmniFluo 900 series utilizes a 320 mm focal length image-corrected monochromator*.Suppresses image dispersion to a large extent, obtaining excellent imaging quality. Wavelength adjustment is driven by a stepper motor.*The small scanning step is 0.005 nm. Equipped with a 1200 scale grating, the spectral resolution reaches 0.08 nm with an accuracy of ±0.2 nm and a repeatability of ±0.1 nm.
Sample Measurement Data
Standard sample test data
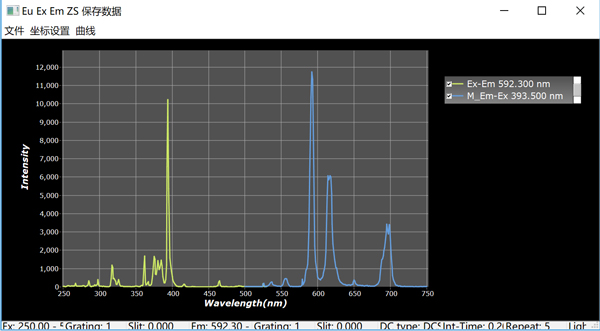
Sample: Europium (europium), solvent: nitric acid
| Excitation & Emission Spectroscopy:
Excitation light source: 75W xenon lamp Scanning step: 1nm
Excitation spectrum: excitation scanning: 250nm-530nm, emission wavelength: 592.3nm
Emission spectrum: excitation wavelength: 393.5nm, emission scan: 500-750nm
|
 |
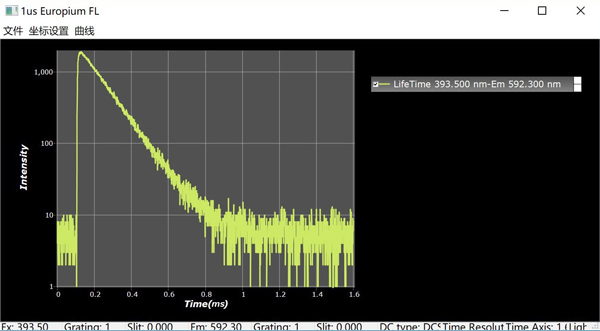
| Fluorescence lifetime test:
Excitation wavelength: 393.5nm@ microsecond pulsed xenon lamp Emission wavelength: 592.3nm
Repeats: 1000 Fitting lifetime: 117 μs
|
 |
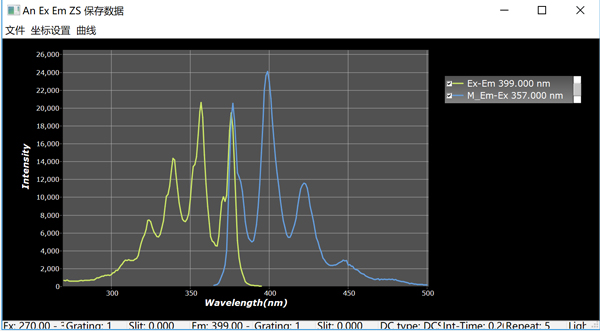
Sample: Anthracene (anthracene), Solvent: cyclohexane
| Excitation & Emission Spectroscopy
Excitation light source: 75W xenon lamp Scanning step: 1nm
Excitation spectroscopy test: excitation scan: 270nm-395nm.
Emission wavelength: 399nm
Emission spectrum test: excitation wavelength: 357nm,
Emission scan: 365nm-500nm
|
 |
| Fluorescence lifetime test:
Excitation wavelength: 375nm picosecond pulsed laser Trigger frequency: 1MHz
Emission wavelength: 399nm Fitting lifetime: 5.3ns
|
 |
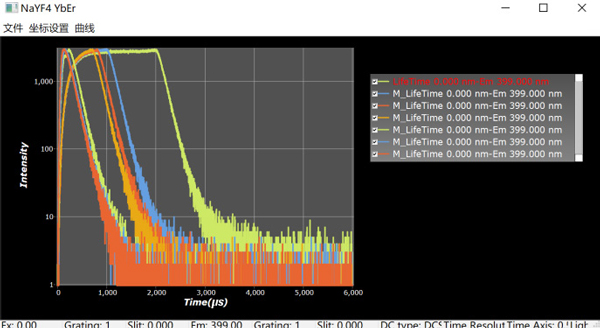
Rare earth upconversion fluorescence test
Sample: NaYF4:Yb,Er solution
| Steady-state spectra:
Excitation source: 980nm continuous laser Emission scanning: 500nm-600nm
Scanning step: 1nm
|
 |
| Lifetime testing:
Excitation source: 980nm continuous laser with modulated output Trigger frequency:
100Hz
Emission wavelength: 544nm
|
 |
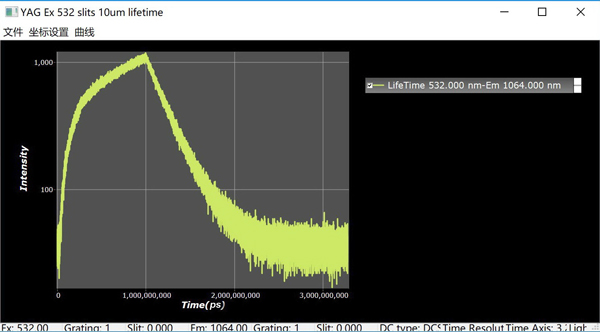
Sample: YAG:Er crystal
| Excitation source: 532nm continuous laser Emission scan: 900-1400nm
Detector: TE-PMT-H10330C-75 Counting: Single photon counter
Slit: 10μm
|
 |
| Lifetime testing:
Excitation source: 532nm continuous laser with modulated output Modulation: 100Hz
Emission wavelength: 1064nm
|
 |
Mid-infrared spectroscopy test data, time-resolved emission spectroscopy, variable-temperature fluorescence spectroscopy, fluorescence spectroscopy of X-ray-excited scintillators, quantum yield measurements, and microscopic spectroscopy tests are available for download.
According to the actual needs of different users, our company has different types of models to choose from
Near- and mid-infrared spectral detection, etc..